
Are You Saying TAN or TAM?
Are You Saying TAN or TAM?
A way to think about assumptions

If you enjoy these, please:
Open Bloomberg, CapIQ or FactSet and data is presented at the company level. When a company’s revenue grows at 30% a year for a few years in a row, we forget to consider this within the broader market context to determine sustainability. Afterall, implicit in every company assumption is a market assumption. Most companies eventually become saturated in the market and revenue growth slows. At this point, we hope the company is spitting off cash and giving it back in the form of dividends; or that we enjoyed the ride along the way as the market rewarded growth. But how can we know when a company will slow? Unfortunately, we can’t. However, using the Total Addressable Market (TAM) will give us some guardrails about what assumptions are baked into the company assumptions. I recognize TAM is also an estimate and should be treated as such but is still a useful tool for analyzing company level estimates. This post is not rocket science, but it’s an important concept to consider that sometimes gets overlooked.
The ‘AMs:

USING TAM
If you can figure out what the TAM of a market is, it becomes a lot easier to see if your expectations for a company’s growth are realistic. If you don’t have a sense of the TAM, the rest of your company specific estimates are somewhat irrelevant – so know your markets. Then, using TAM, we can work backwards to see if our assumptions are realistic.
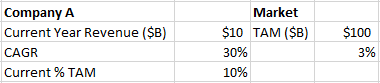
Let’s assume Company A is growing revenue at 30% a year with a current market share of 10%, while the overall market is growing at 3%.
Scenario:
Forecast:
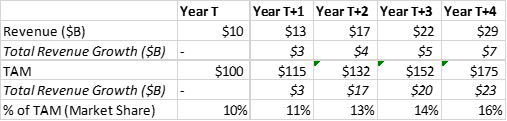
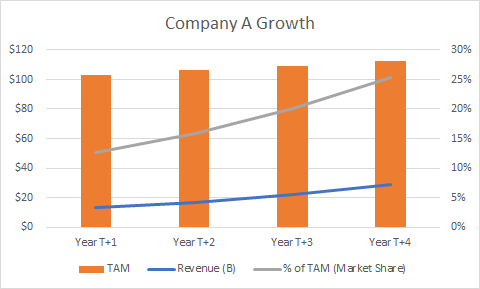
Now, it’s easy to see that we are growing the market share of the company much faster than the revenue. At year four, the market share of the company is 25% of the total market – compounding quickly adds up. If nothing else, I think showing the growth of market share alongside the company’s revenue growth shows how quickly compounding adds up for a 30% CAGR. This means that after the first year, Company A is growing revenue by taking share from other companies in the market. At year T+3, ~40% of new revenue must come from other players in the market and over 50% in year T+4. This is possible but capturing revenue from existing players is usually harder than growing alongside the market. This may mean that the cost of acquiring customers (CAC) went up alongside this revenue growth and profit margins went down. Or it could be that scale economics are increasing at a faster rate than CAC. But what if there are no scale economics?
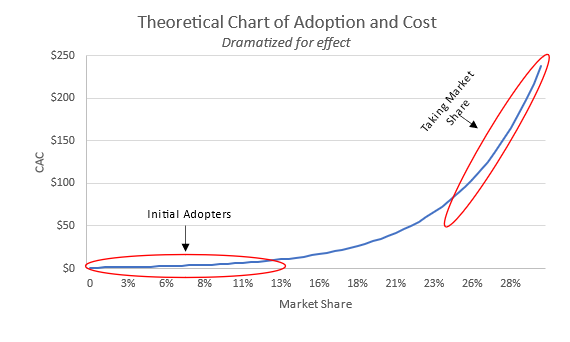
What the above chart shows is that if you want to capture more of the revenue in a market, sometimes the economics start to work against you as you become a larger player in that market. To grow your revenue, you have to start taking customers, and this costs more if you don’t have the benefits of scale. That good looking Lifetime Value of a Customer is no longer as appealing: monetization per customer decreases as you sink dollars fighting for new market share (hello electric scooter wars of 2019).
Further Forecasting
And just for fun, let’s see what happens if the company keep growing at 30% for another four years.

Eight years out and now 64% of the market feels unrealistic. This seems to suggest that some of our initial assumptions are off. Either I underestimated market growth or overestimated the company’s average growth. And sure, there are companies like Amazon and Microsoft that grow by developing new business lines (e.g., Cloud Computing), but for the most part, companies don’t have the foresight, resources, or scale to make this happen.
Another thing TAM can help us think about: how much does the market need to grow for my assumptions to be realistic? And from what I know about the market, is this estimate reasonable? For instance, continuing with the above scenario, the market would need to grow at 9% for a revenue growth of 30% a year to only be 20% of the market share in year 4. Now, if you feel comfortable with 9% market growth, great! If that makes you uneasy, you may need to consider the company level assumptions a little more closely.
A lot of people will ask - what about companies that expand the market? Well, off the top of my head, I can think of few companies that create new markets or expand the market: Amazon via AWS made the cloud accessible; Apple brought the PC to our pockets; and Stripe allowed for retail stores to accept payments online. Ultimately though, it is unlikely the company you’re examining is doing this. If the company is, you should still try to determine what portion of the expanding TAM your company is responsible for.
Conclusion
Unless the company you’re looking at is in the rare position to expand the addressable market, you should do your best to understand what the addressable market is. Most markets have a ceiling. It is important to know what that ceiling is and build reasonable assumptions accordingly. If you have a good sense of the market TAM you can work backwards and get a sense of whether your company level assumptions look realistic or whether you are working off unattainable assumptions. You can always be wrong – but if you’re wrong on the TAM, it’s almost impossible to be right on the company. Bottomline: I will take a fast-growing market over a fast-growing company in a dying market over the next five years.
Disclaimer: All opinions expressed by the author are his own opinions and do not reflect the opinion of Old Well Partners. This article is for informational purposes only and should not be relied upon as a basis for investment decisions nor constitute a general or personal recommendation or take into account the particular investment objectives, financial situations, or needs of individual investors. Old Well Partners may maintain positions in the securities discussed in this article.